2023 Nebraska vs. 2022 Nebraska football stats matchup
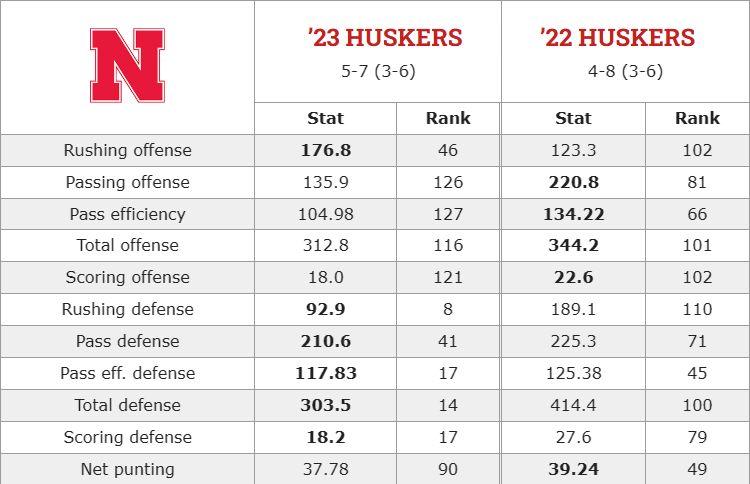
Here’s how the 2023 and 2022 Cornhuskers compare statistically after their 12-game seasons. Average national ranking in categories listed: ’23 Huskers 64.1, ’22 Huskers 81.9.
 | ’23 HUSKERS5-7 (3-6) | ’22 HUSKERS4-8 (3-6) | |||
|---|---|---|---|---|---|
| Stat | Rank | Stat | Rank | ||
| Rushing offense | 176.8 | 46 | 123.3 | 102 | |
| Passing offense | 135.9 | 126 | 220.8 | 81 | |
| Pass efficiency | 104.98 | 127 | 134.22 | 66 | |
| Total offense | 312.8 | 116 | 344.2 | 101 | |
| Scoring offense | 18.0 | 121 | 22.6 | 102 | |
| Rushing defense | 92.9 | 8 | 189.1 | 110 | |
| Pass defense | 210.6 | 41 | 225.3 | 71 | |
| Pass eff. defense | 117.83 | 17 | 125.38 | 45 | |
| Total defense | 303.5 | 14 | 414.4 | 100 | |
| Scoring defense | 18.2 | 17 | 27.6 | 79 | |
| Net punting | 37.78 | 90 | 39.24 | 49 | |
| Punt returns | 3.00 | 121 | 16.50 | 7 | |
| Kickoff returns | 22.33 | 27 | 17.08 | 116 | |
| Turnover margin | -1.42 | 129 | -0.25 | 88 | |
| Tackles for loss | 6.3 | 28 | 5.0 | 99 | |
| Sacks | 2.67 | 26 | 1.75 | 100 | |
| Sacks allowed | 2.42 | 89 | 2.71 | 94 | |
| Third-down conversion | 0.379 | 78 | 0.400 | 57 | |
| Third-down defense | 0.367 | 47 | 0.424 | 104 | |
| Fourth-down conversion | 0.500 | 68 | 0.429 | 94 | |
| Fourth-down defense | 0.391 | 20 | 0.667 | 121 | |
| Red zone offense | 0.690 | 128 | 0.853 | 54 | |
| Red zone defense | 0.816 | 53 | 0.902 | 116 | |
| First downs offense | 198 | 119 | 217 | 101 | |
| First downs defense | 199 | 14 | 276 | 112 | |
| Fewest penalties | 5.08 | 32 | 5.42 | 39 | |
| Fewest penalty yards | 42.75 | 23 | 42.50 | 21 | |
| Time of possession | 30:54 | 43 | 26:44 | 124 | |
| Power index* | 0.7 | 61 | -0.7 | 70 | |
| Efficiency: Offense* | 30.8 | 110 | 43.7 | 74 | |
| Efficiency: Defense* | 73.8 | 18 | 40.7 | 91 | |
| Efficiency: Spec. Teams* | 45.1 | 93 | 51.9 | 56 | |
| Efficiency: Overall* | 52.9 | 62 | 40.7 | 86 | |
| Schedule strength* | 69 | 69 | 55 | 55 | |
| *ESPN FPI analytics. | |||||
• Click on column headers to sort